This post is also available in:
![]() English (英语)
English (英语)
How do you visualize the health of a rapidly-changing industry? The Air Current in partnership with Visual Approach Analytics brings you the quarterly U.S. Airline Industry Visualization.
May 18, 2021: Our fourth quarter 2020 U.S. Airline Industry Visualization is NOW AVAILABLE. Subscribe per quarter or purchase a single copy.
Here’s a free look at our 53-page third quarter 2020 report.
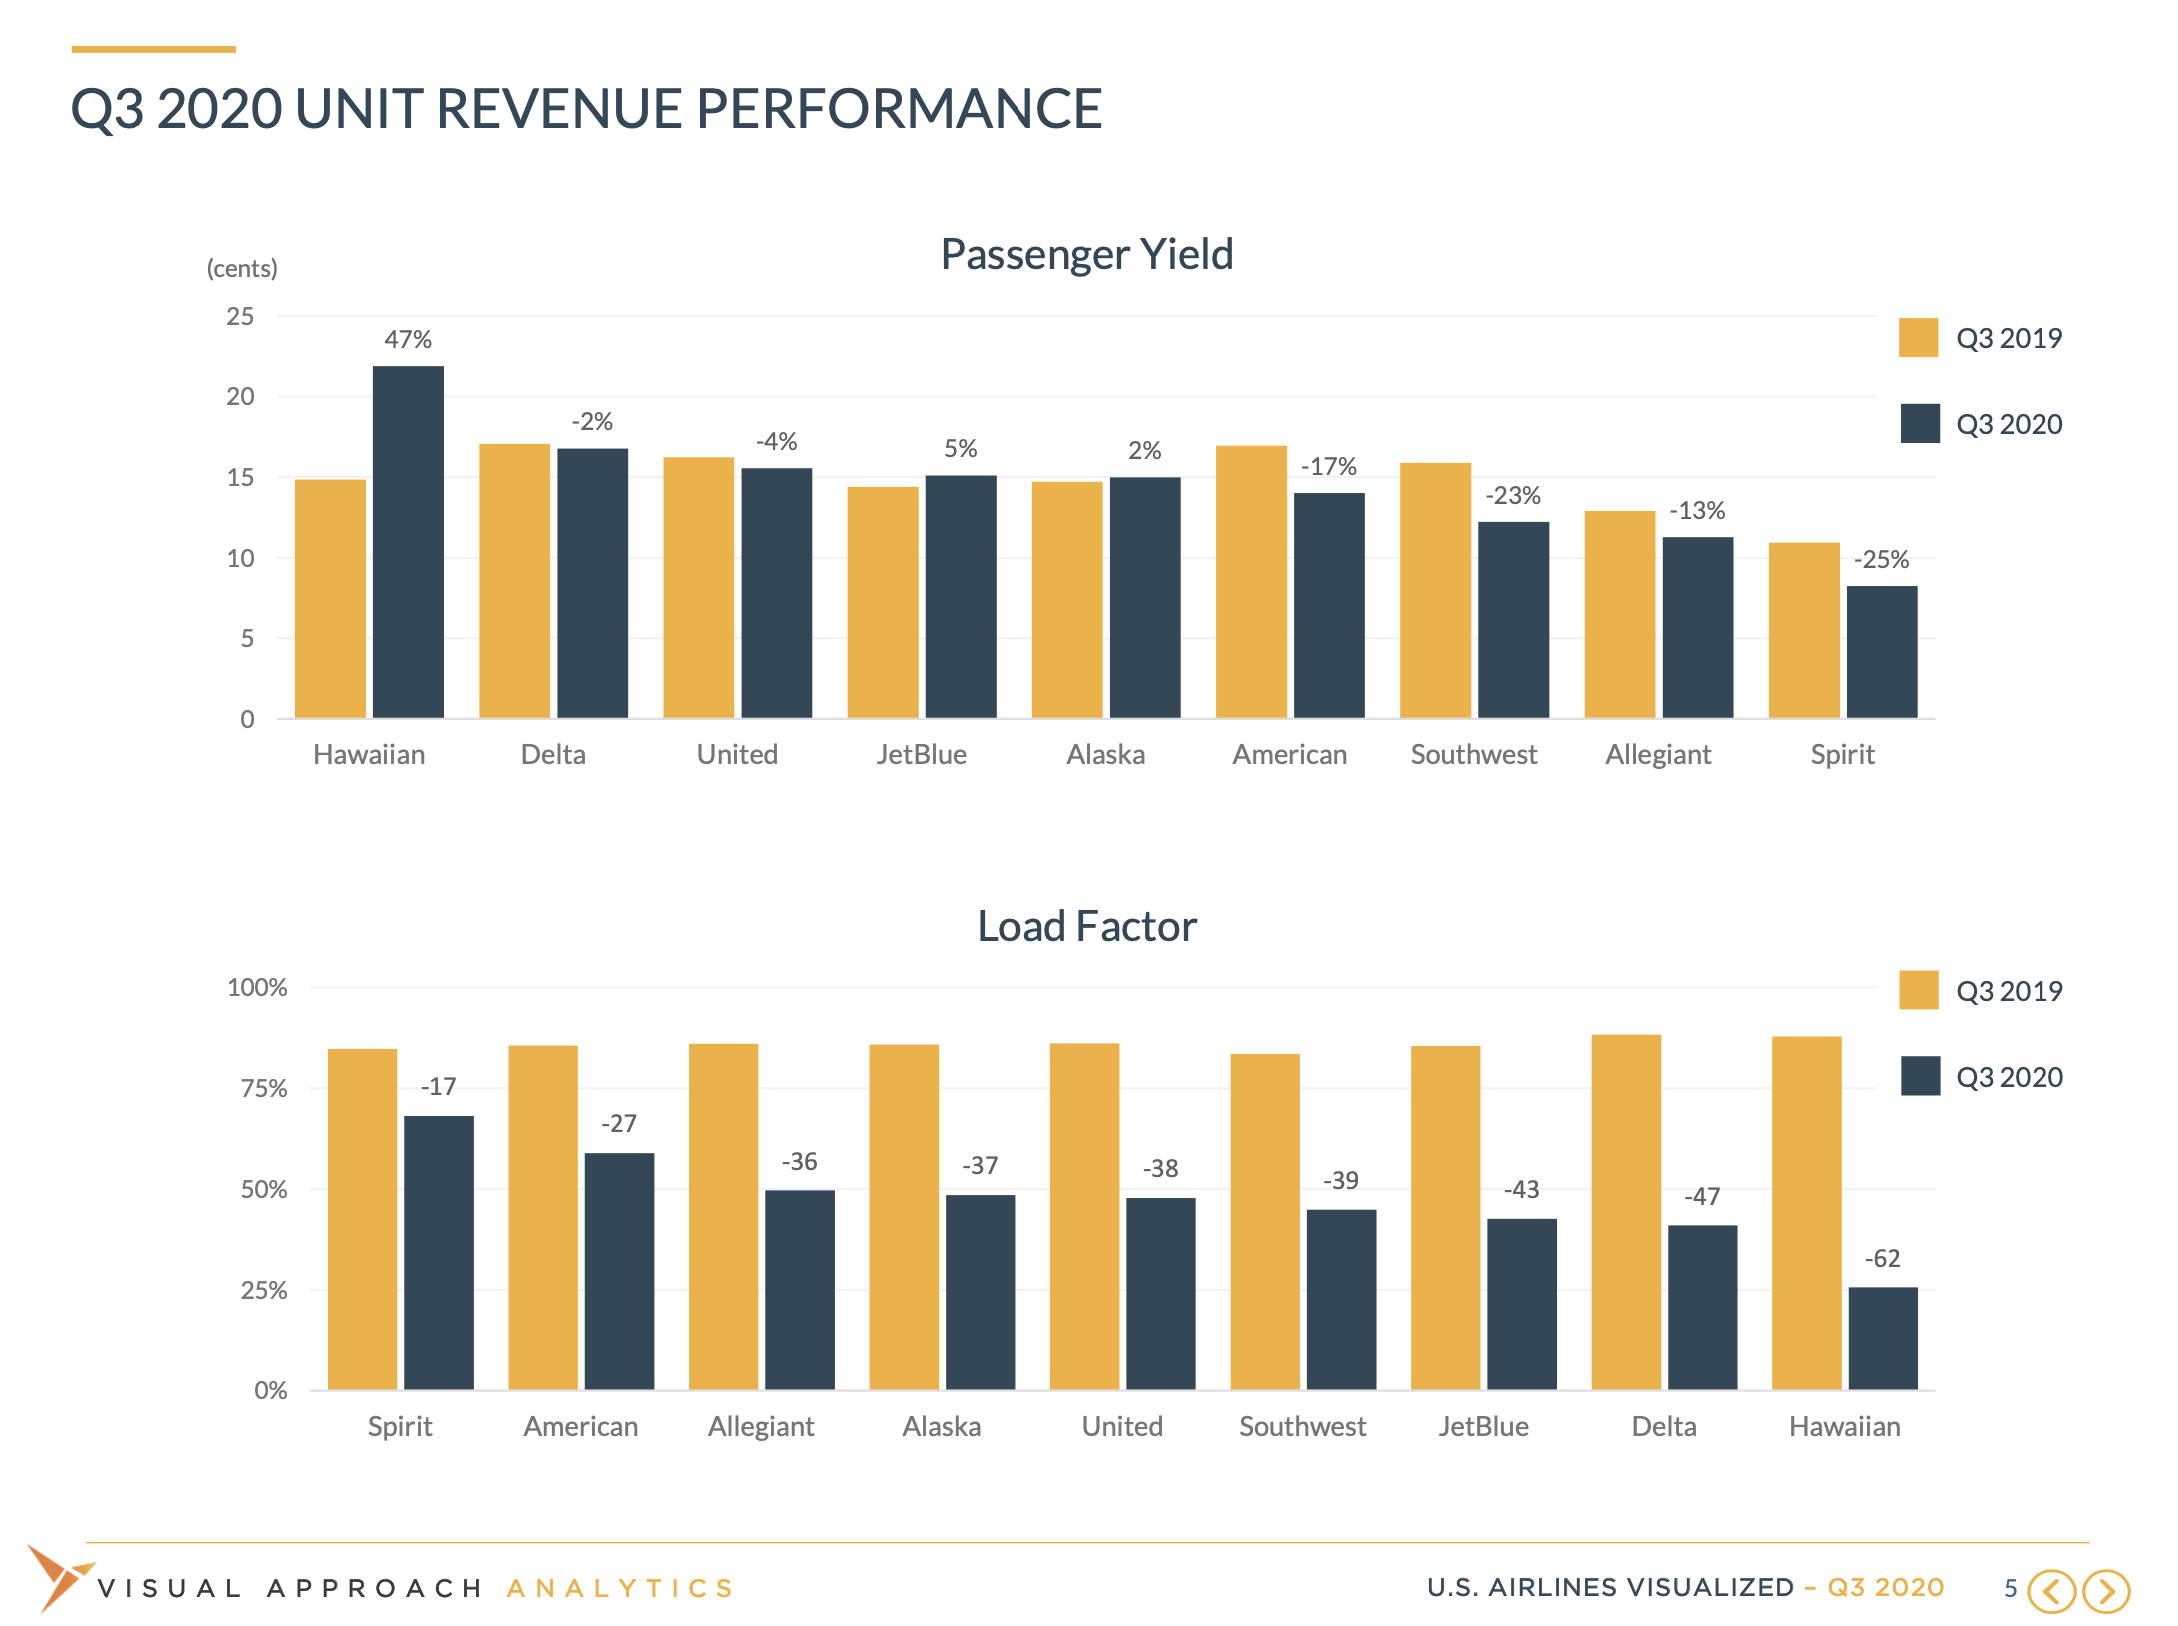
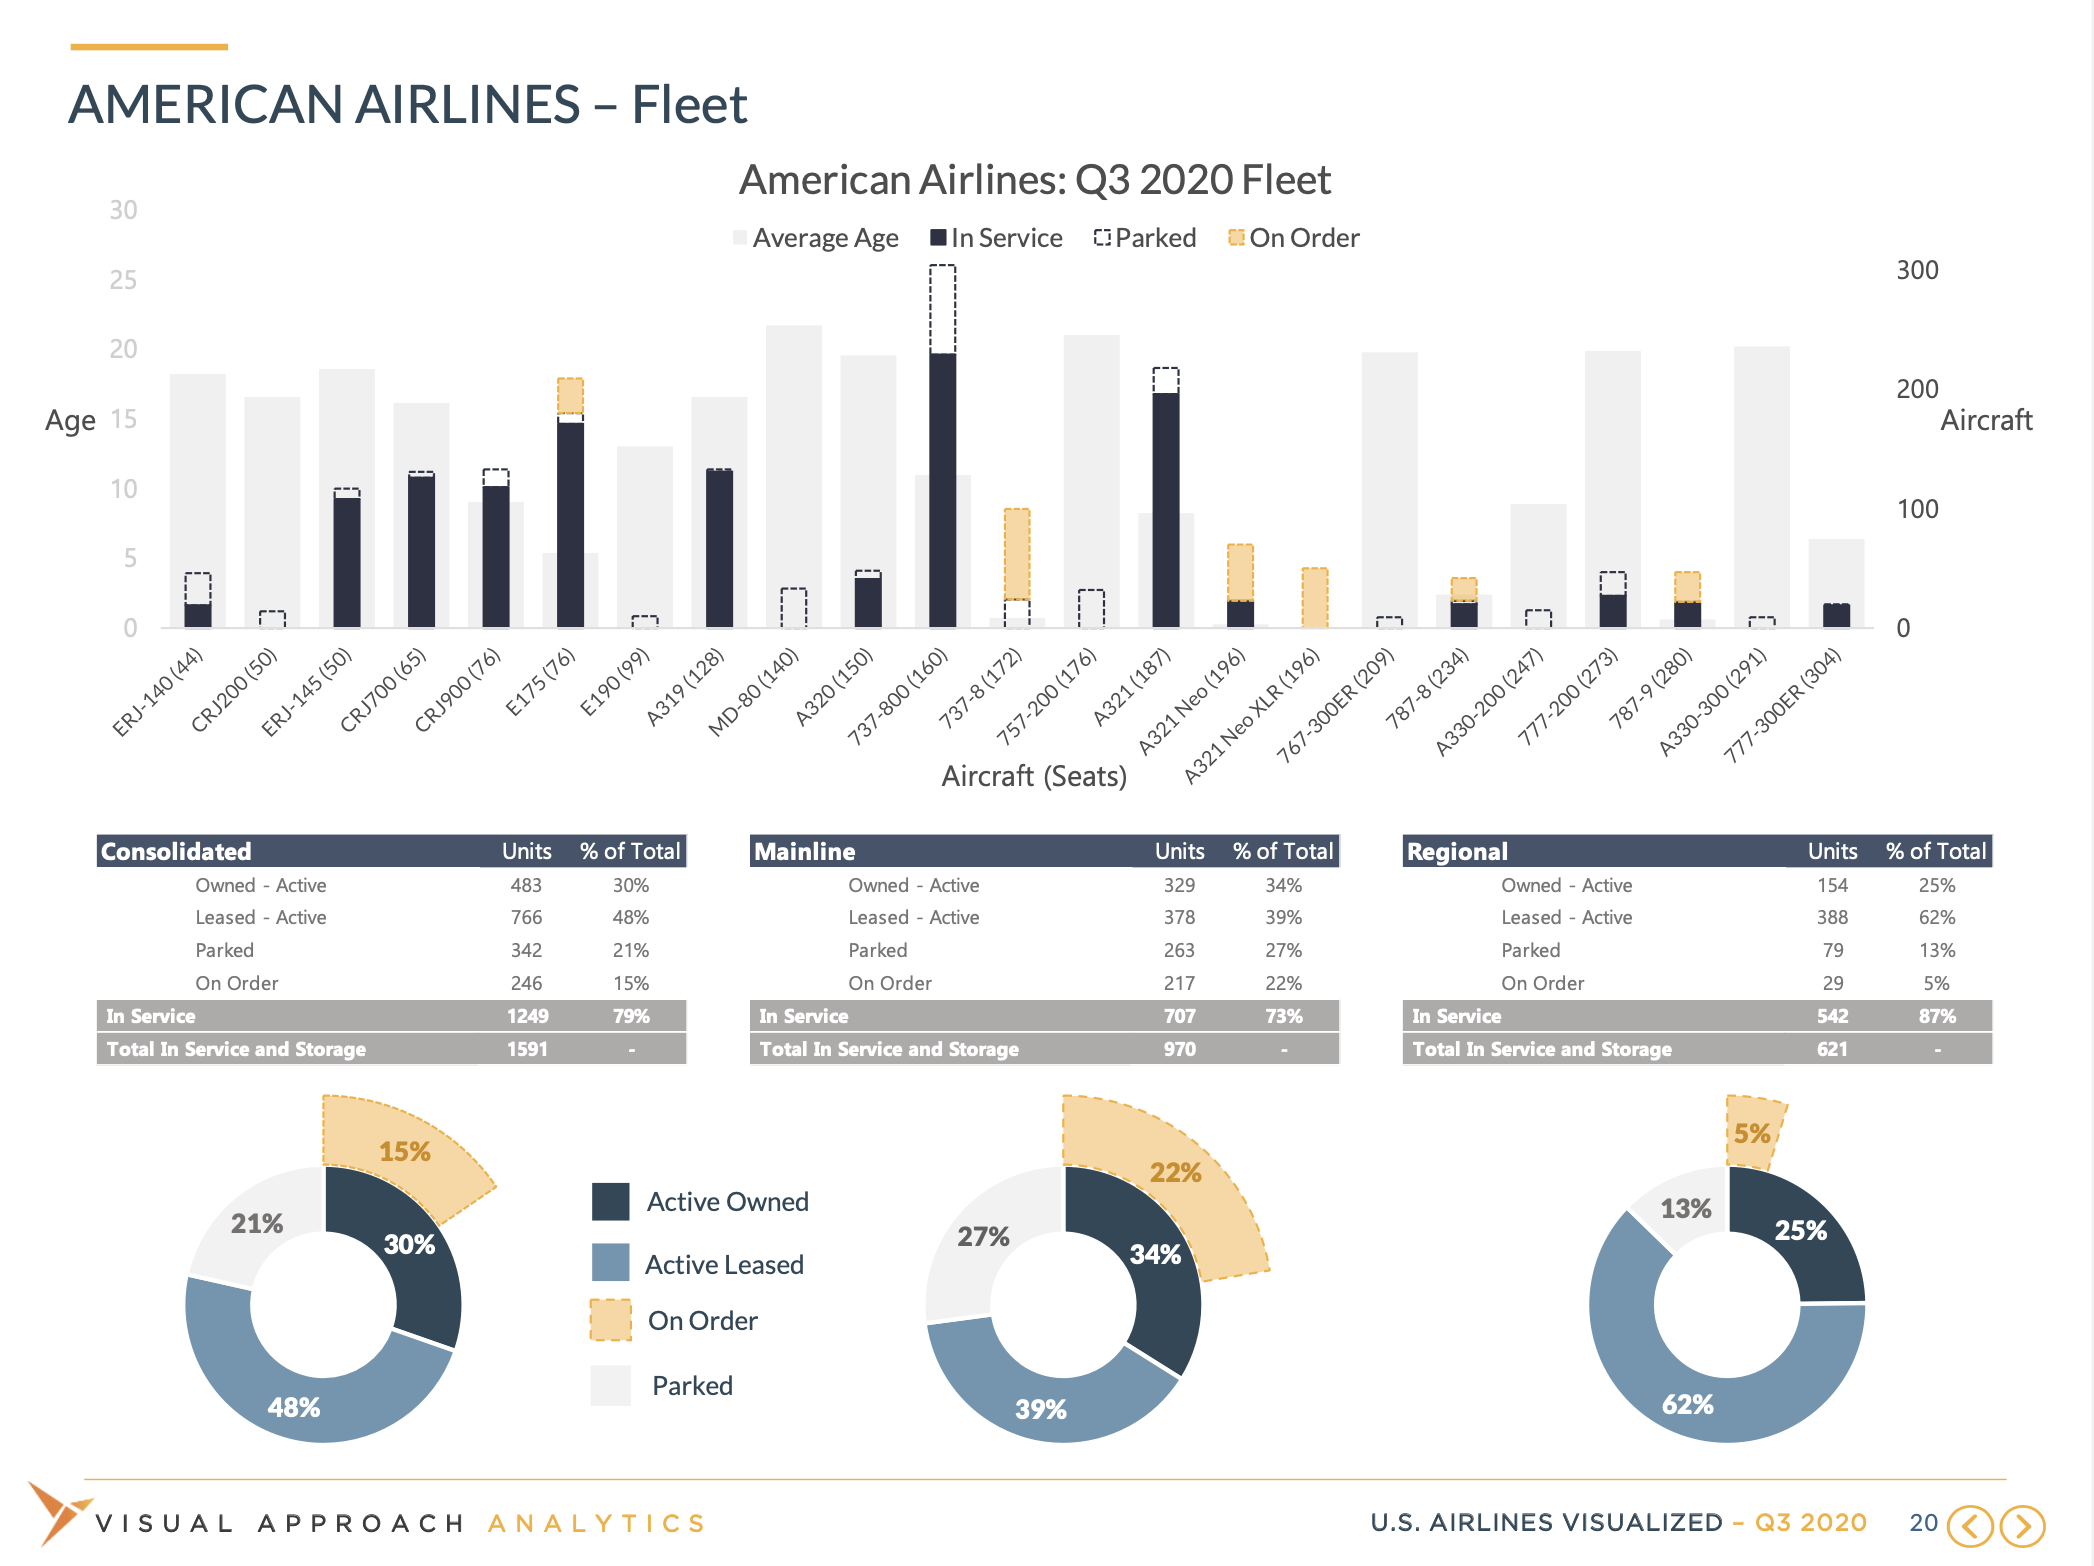
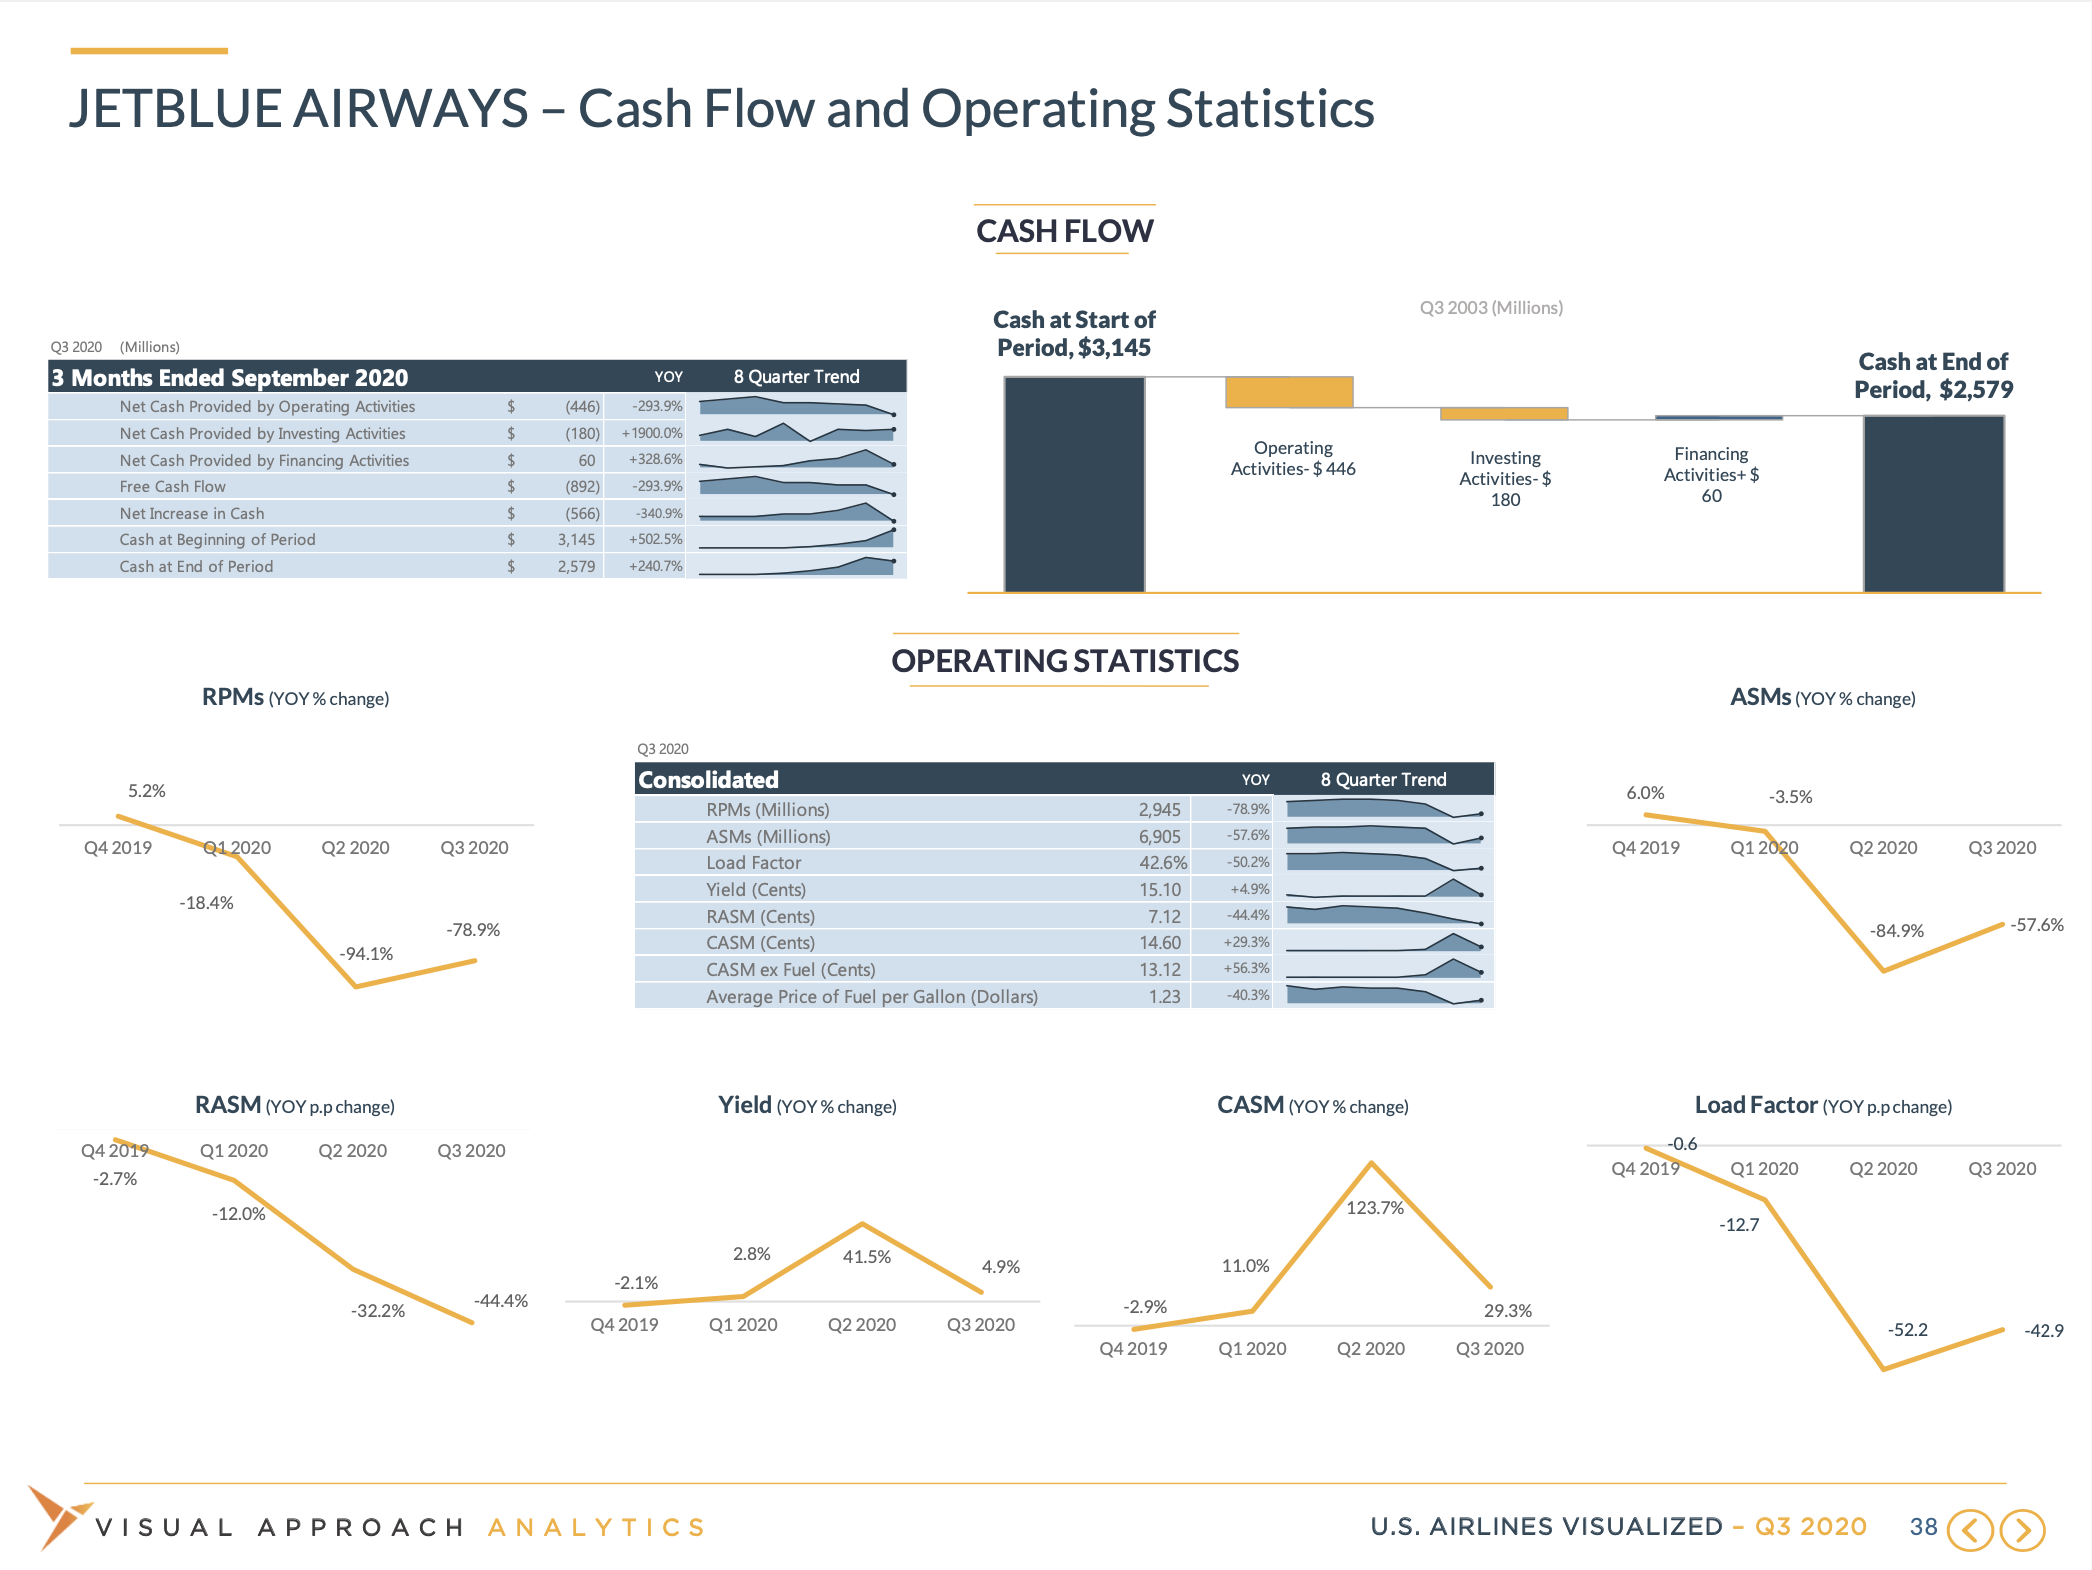
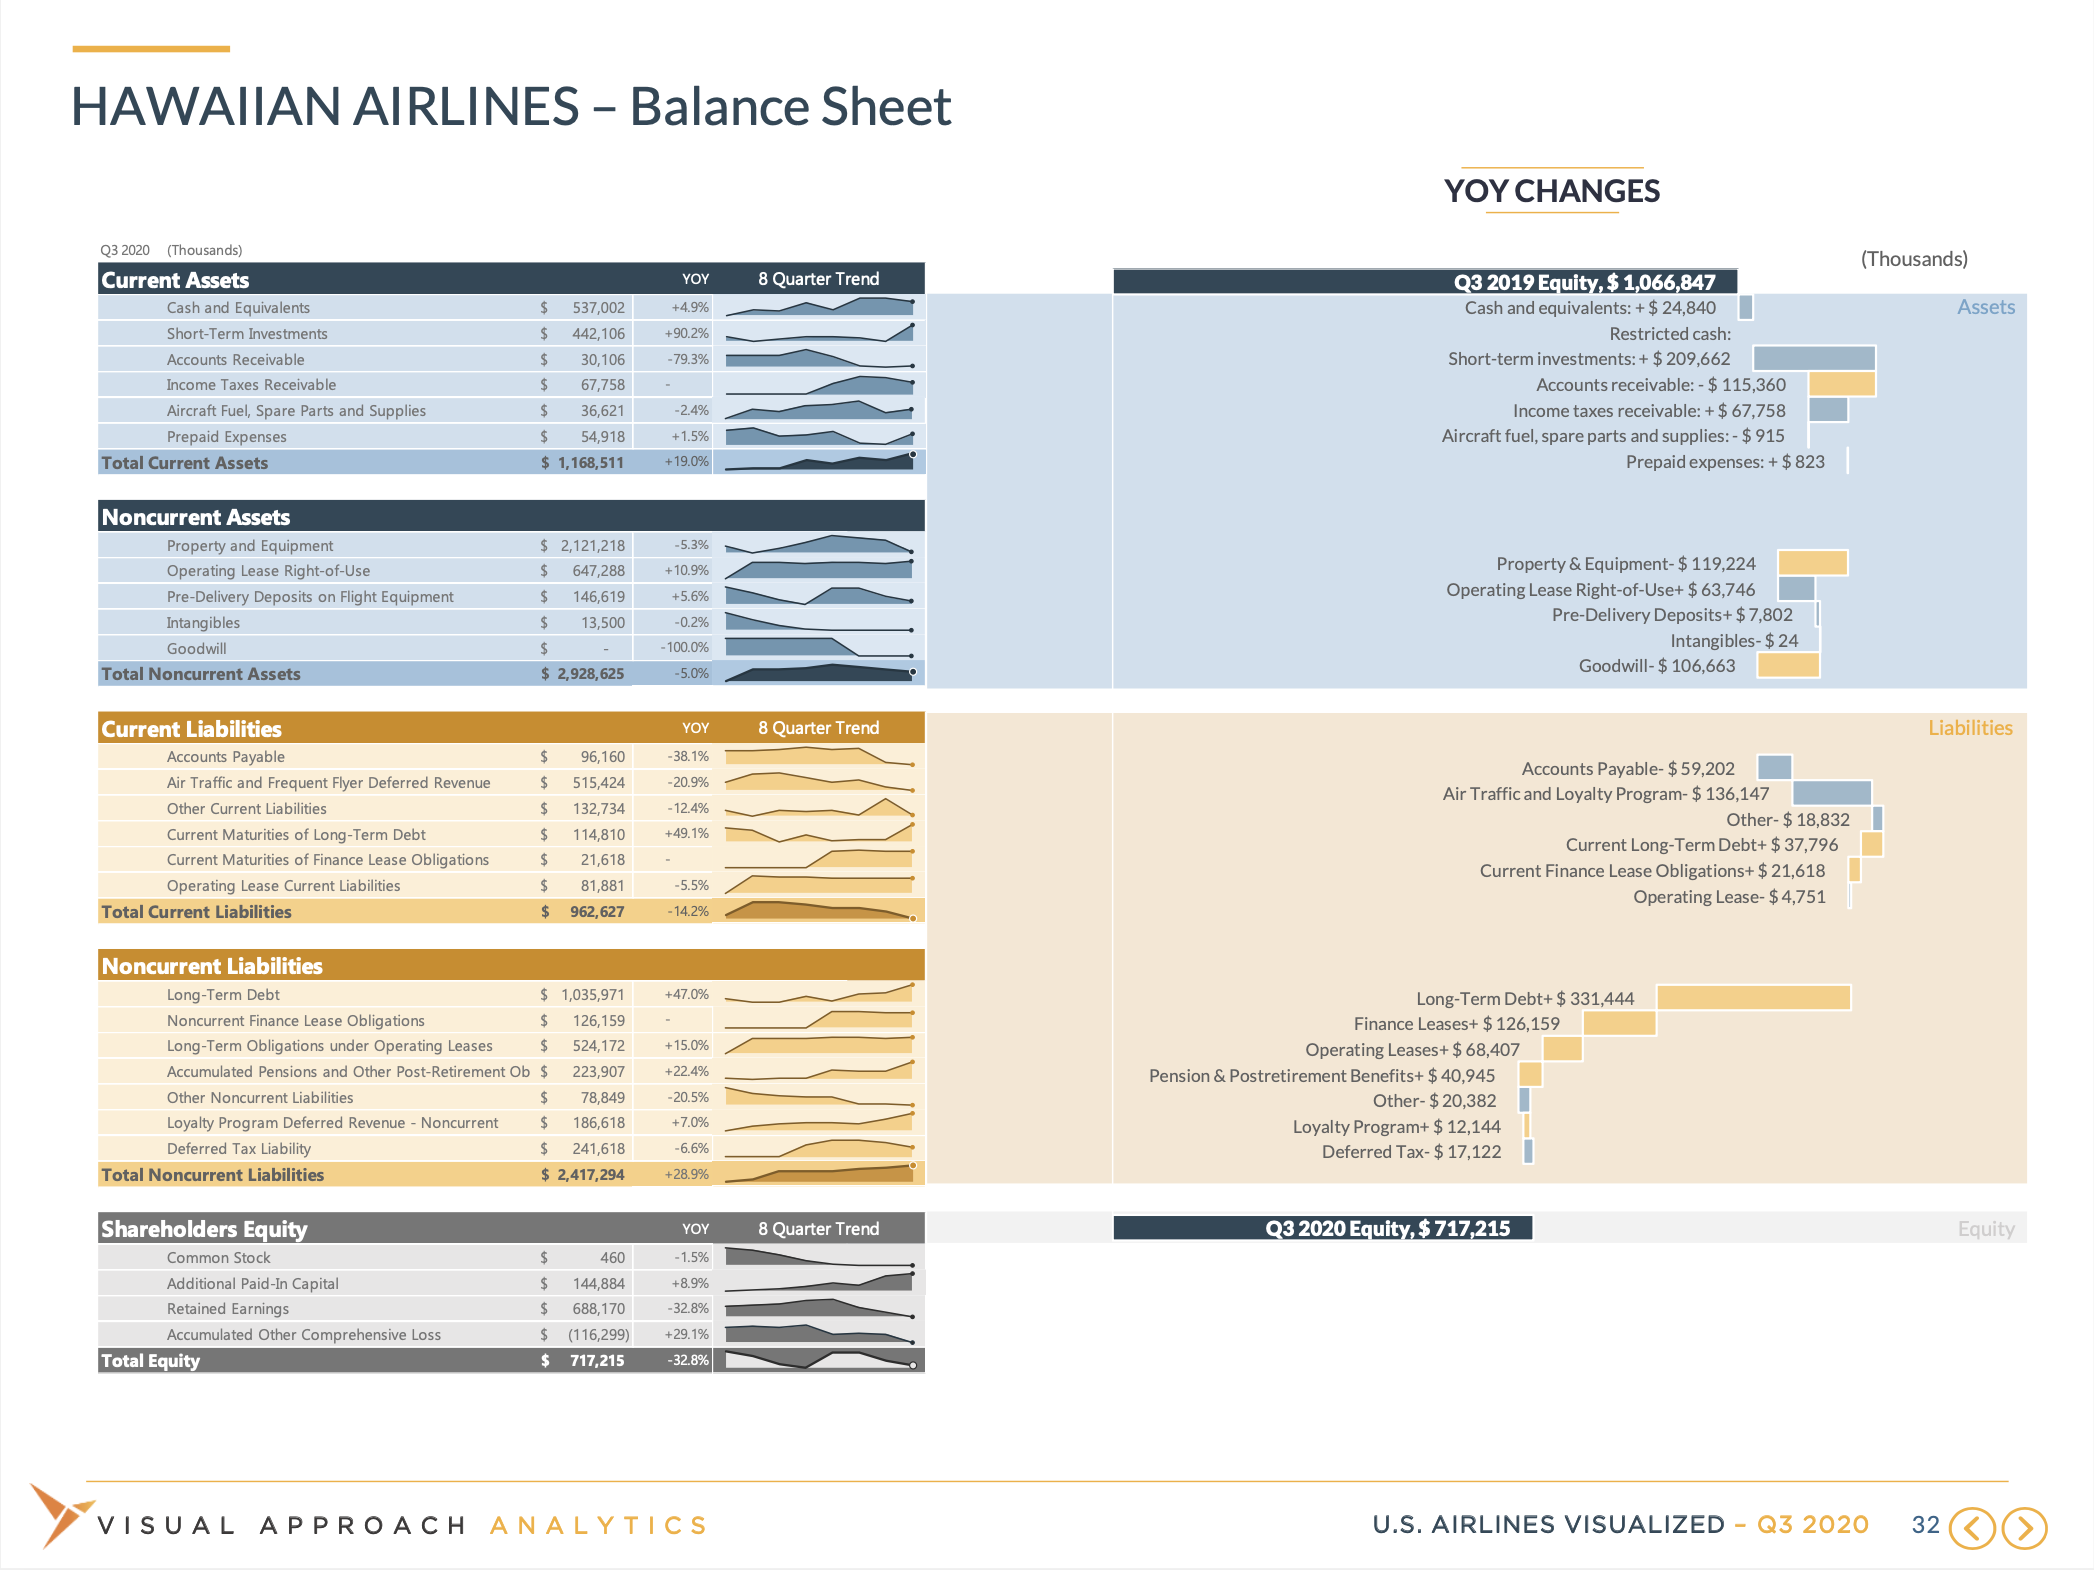
The AIV is at once a valuable at-a-glance resource for understanding the trajectory of the U.S. air transport industry as it fights its way through the COVID-19 pandemic, while providing the underlying granular metrics and their historical trend. Each airline is broken down into four sections: fleet, income statement, balance sheet, and cash flow and operating statistics.
Single-quarter Subscription - $99
The visualization goes far beyond the typical high level stats used to measure airline performance, breaking down the individual metrics that drive cash flows, revenues, operating expenses and non-operating expenses at each carrier. Each fleet report is a dashboard-style insight into the most important airline assets broken down by average age, number in service, parked and on order.
The quarterly report covers nine publicly traded U.S. airlines: Alaska Airlines, American Airlines, Allegiant Air, Delta Air Lines, Hawaiian Airlines, JetBlue Airways, Southwest Airlines, Spirit Airlines and United Airlines.
The Air Current and Visual Approach are offering each report for $99 per quarter. Each report is available 10 days or less after the last airline reports. Report subscriptions are automatically renewed at full price unless you opt out. Please feel free to contact us if you have any questions.
More samples: